Note
Go to the end to download the full example code.
Shear Extrapolation#
This example shows how to perform shear extrapolation of a wind speed time series.
Simple shear extrapolation#
First, we need to prepare the sample data. Let’s create some wind speed time series data with tree heights present.
import numpy as np
import pandas as pd
import xarray as xr
import windkit as wk
import matplotlib.pyplot as plt

wind_speed = xr.DataArray(
    np.array([[10.0, 12.0, 14.0], [10.5, 12.5, 14.5], [11.0, 13.0, 15.0]]).T,
    dims=["time", "height"],
    coords={
        "time": pd.date_range("2023-01-01", periods=3, freq="h"),
        "height": [10.0, 30.0, 40.0],
    },
)

print(wind_speed)
<xarray.DataArray (time: 3, height: 3)> Size: 72B
array([[10. , 10.5, 11. ],
       [12. , 12.5, 13. ],
       [14. , 14.5, 15. ]])
Coordinates:
  * time     (time) datetime64[us] 24B 2023-01-01 ... 2023-01-01T02:00:00
  * height   (height) float64 24B 10.0 30.0 40.0
Let’s say we want to extrapolate this data to 100 m using a fixed shear exponent of 0.143.
To do that, we can use windkit.shear_extrapolate.
wind_speed_new = wk.shear_extrapolate(wind_speed, 100, shear_exponent=0.143)

print(wind_speed_new)
<xarray.DataArray (time: 3, height: 1)> Size: 24B
array([[12.54001646],
       [14.82001945],
       [17.10002244]])
Coordinates:
  * time     (time) datetime64[us] 24B 2023-01-01 ... 2023-01-01T02:00:00
  * height   (height) int64 8B 100
When more heights are present in the orignal wind speed DataArray, the height closest to the requested height is used.
Multiple target heights can be requested when the wind speed data has structured heights.:
wind_speed_new = wk.shear_extrapolate(wind_speed, [50, 100, 200], shear_exponent=0.143)

print(wind_speed_new)
<xarray.DataArray (time: 3, height: 3)> Size: 72B
array([[11.35666505, 12.54001646, 13.84667171],
       [13.42151324, 14.82001945, 16.36424839],
       [15.48636143, 17.10002244, 18.88182506]])
Coordinates:
  * time     (time) datetime64[us] 24B 2023-01-01 ... 2023-01-01T02:00:00
  * height   (height) int64 24B 50 100 200
Varying shear#
The shear exponent can be varied, including adding shear at different heights. When the shear exponent vary with the height, the shear nearest to the reference heights used, is taken, e.g., if the original wind speed is at 40.0 meters and the shear is at 30 and 60 meters, the shear at 30 is used.
shear_exponent = xr.DataArray(
    np.array([[0.113, 0.113, 0.113], [0.123, 0.123, 0.123], [0.133, 0.133, 0.133]]).T,
    dims=["time", "height"],
    coords={
        "time": pd.date_range("2023-01-01", periods=3, freq="h"),
        "height": [15.0, 20.0, 35.0],
    },
)

wind_speed_new = wk.shear_extrapolate(
    wind_speed, [15, 25, 45], shear_exponent=shear_exponent
)

print(wind_speed_new)
<xarray.DataArray (time: 3, height: 3)> Size: 72B
array([[10.46883397, 10.26715234, 11.17367334],
       [12.56260077, 12.2228004 , 13.20525031],
       [14.65636756, 14.17844846, 15.23682728]])
Coordinates:
  * time     (time) datetime64[us] 24B 2023-01-01 ... 2023-01-01T02:00:00
  * height   (height) int64 24B 15 25 45
Unstructured data#
The input wind speed can also be at unstructured heights, a-la datasets with “point”-structure , e.g., from a LiDAR. The shear extrapolation still works as expected. However, the only one height can be requested, or varying heights that match the dimensions of the wind speed data.
wind_speed = xr.DataArray(
    np.array([[10.0, 10.0], [11.0, 11.0], [12.0, 12.0], [13.0, 13.0]]).T,
    dims=("time", "point"),
    coords={
        "time": pd.date_range("2023-01-01", periods=2, freq="h"),
        "height": (("point",), [10, 20.0, 30.0, 40.0]),
        "west_east": (("point",), [0, 0, 1, 2]),
        "south_north": (("point",), [-3, -3, -2, -1]),
    },
)
wind_speed_new = wk.shear_extrapolate(wind_speed, 100.0, shear_exponent=0.143)
print(wind_speed_new)
<xarray.DataArray (time: 2, point: 4)> Size: 64B
array([[13.89952631, 13.84667171, 14.25453014, 14.82001945],
       [13.89952631, 13.84667171, 14.25453014, 14.82001945]])
Coordinates:
  * time         (time) datetime64[us] 16B 2023-01-01 2023-01-01T01:00:00
    west_east    (point) int64 32B 0 0 1 2
    south_north  (point) int64 32B -3 -3 -2 -1
    height       (point) float64 32B 100.0 100.0 100.0 100.0
Dimensions without coordinates: point
When the wind speeds are at unstructured heights, only one target height can be used, or varying heights that match the dimensions of the wind speed data (e.g., different heights at different points) and similarly for the shear exponent. Let’s say we want to extrapolate to different heights at different points, with a time-varying shear exponent. We can do that like this:
height = xr.DataArray(
    np.array([10, 50.0, 150.0, 250.0]),
    dims=["point"],
    coords={
        "height": (("point",), [10, 50.0, 150.0, 250.0]),
        "west_east": (("point",), [0, 0, 1, 2]),
        "south_north": (("point",), [-3, -3, -2, -1]),
    },
)

shear_exponent = xr.DataArray(
    np.array([-0.113, 0.113]),
    dims=["time"],
    coords={
        "time": pd.date_range("2023-01-01", periods=2, freq="h"),
    },
)

wind_speed_new = wk.shear_extrapolate(wind_speed, height, shear_exponent=shear_exponent)
print(wind_speed_new)
<xarray.DataArray (time: 2, point: 4)> Size: 64B
array([[10.        ,  9.91803106, 10.00455176, 10.56839192],
       [10.        , 12.20000212, 14.39344844, 15.99107994]])
Coordinates:
  * time         (time) datetime64[us] 16B 2023-01-01 2023-01-01T01:00:00
    west_east    (point) int64 32B 0 0 1 2
    south_north  (point) int64 32B -3 -3 -2 -1
    height       (point) float64 32B 10.0 50.0 150.0 250.0
Dimensions without coordinates: point
Custom shear exponent calculation#
The shear exponent can also be calculated from the wind speed data itself,
using the windkit.shear_exponent function. This function computes the shear
exponent from vertical wind speed profiles using finite differences in log-space.
If only a single height is present for a given horizontal location, the shear exponent
is set to NaN for that location (so for points (1,-2) and (2,-1) in the below example).
In the example below, we first compute the shear exponent
from the wind speed data, interpolate the shear to the original data structure and
finally use it for shear extrapolation to 100 m. Similar to before, the wind speed
can only be extrapolated to a single height when the data is at unstructured heights.
wind_speed = xr.DataArray(
    np.array([[10.0, 10.0], [11.0, 11.0], [12.0, 12.0], [13.0, 13.0]]).T,
    dims=("time", "point"),
    coords={
        "time": pd.date_range("2023-01-01", periods=2, freq="h"),
        "height": (("point",), [10, 40.0, 30.0, 40.0]),
        "west_east": (("point",), [0, 0, 1, 2]),
        "south_north": (("point",), [-3, -3, -2, -1]),
    },
)
wind_speed = wk.spatial.set_crs(wind_speed, 4326)
shear_exp = wk.shear_exponent(wind_speed)
shear_exp = wk.spatial.interp_unstructured_like(shear_exp, wind_speed, method="nearest")
wind_speed_new = wk.shear_extrapolate(wind_speed, 100.0, shear_exponent=shear_exp)
print(wind_speed_new)
<xarray.DataArray (time: 2, point: 4)> Size: 64B
array([[11.71525543, 11.71525543, 13.03557165, 13.84530187],
       [11.71525543, 11.71525543, 13.03557165, 13.84530187]])
Coordinates:
  * time         (time) datetime64[us] 16B 2023-01-01 2023-01-01T01:00:00
    west_east    (point) int64 32B 0 0 1 2
    south_north  (point) int64 32B -3 -3 -2 -1
    height       (point) float64 32B 100.0 100.0 100.0 100.0
    crs          int8 1B 0
Dimensions without coordinates: point
Finally, we can also extrapolate to varying heights when the shear exponent is calculated from the wind speed data itself. Here, we create a new dataset with different heights at each point, and use the shear exponent calculated from the wind speed data for shear extrapolation. Again, the shear exponent is interpolated to the new data structure before use.
wind_speed = xr.DataArray(
    np.array([[10.0, 10.0], [11.0, 11.0], [12.0, 12.0], [13.0, 13.0]]).T,
    dims=("time", "point"),
    coords={
        "time": pd.date_range("2023-01-01", periods=2, freq="h"),
        "height": (("point",), [10, 20.0, 30.0, 40.0]),
        "west_east": (("point",), [0, 0, 0, 0]),
        "south_north": (("point",), [-3, -3, -3, -3]),
    },
)
wind_speed = wk.spatial.set_crs(wind_speed, 4326)
wind_speed = wk.spatial.to_stacked_point(wind_speed)
shear_exp = wk.shear_exponent(wind_speed)
ds = wk.spatial.create_stacked_point(
    [0, 0, 0, 0], [-3, -3, -3, -3], [15, 25.0, 35.0, 45.0], 4326
)
wind_speed_new = wk.shear_extrapolate(wind_speed, ds.height, shear_exponent=shear_exp)
print(wind_speed_new)
<xarray.DataArray (time: 2, stacked_point: 1, height: 4)> Size: 64B
array([[[10.57336364, 11.5395595 , 12.5258748 , 13.43308253]],

       [[10.57336364, 11.5395595 , 12.5258748 , 13.43308253]]])
Coordinates:
  * time         (time) datetime64[us] 16B 2023-01-01 2023-01-01T01:00:00
    south_north  (stacked_point) int64 8B -3
    west_east    (stacked_point) int64 8B 0
  * height       (height) float64 32B 15.0 25.0 35.0 45.0
    crs          int8 1B 0
Dimensions without coordinates: stacked_point
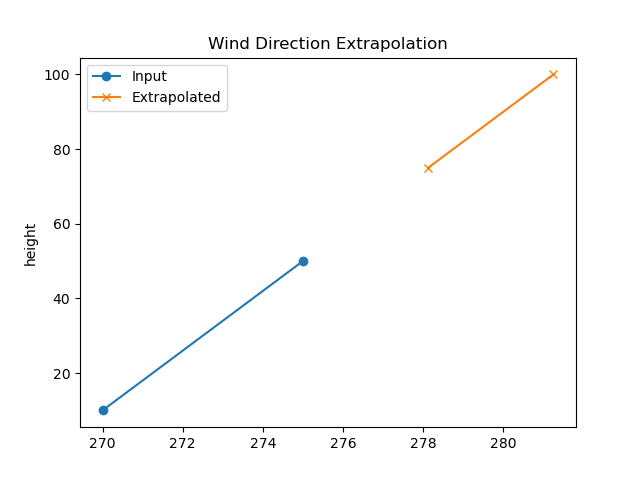
Wind Veer Extrapolation#
The wind direction can also be extrapolated using the windkit.veer_extrapolate function.
This requires a wind veer value, which can be constant or calculated from the data
using windkit.wind_veer.
wind_direction = xr.DataArray(
    np.array([[270.0, 280.0], [275.0, 285.0]]).T,
    dims=["time", "height"],
    coords={
        "time": pd.date_range("2023-01-01", periods=2, freq="h"),
        "height": [10.0, 50.0],
    },
).expand_dims(stacked_point=[0])
wind_direction["west_east"] = ("stacked_point", [0])
wind_direction["south_north"] = ("stacked_point", [0])

# Calculate wind veer
veer = wk.wind_veer(wind_direction)

# Extrapolate to new height
wd_new = wk.veer_extrapolate(wind_direction, [75.0, 100.0], veer=veer)

# Plot the results for the first time step
plt.figure()
wind_direction.isel(time=0).plot(y="height", marker="o", label="Input")
wd_new.isel(time=0).plot(y="height", marker="x", label="Extrapolated")
plt.legend()
plt.title("Wind Direction Extrapolation")
Text(0.5, 1.0, 'Wind Direction Extrapolation')
Total running time of the script: (0 minutes 0.290 seconds)