
PyWAsP: Working with a WAsP workspace (WWH file)#
This tutorial covers how to read a WAsP workspace hierarchy (.wwh) file with windkit, and how to use its contents in pywasp calculations. We will use a workspace of the Serra Santa Luzia site in Portugal, the same site as in the first and fourth tutorials, saved by WAsP 12.10 with default settings. It holds everything needed for a classic WAsP wind farm calculation:
a met station with its observed wind climate,
a vector map with elevation contours and roughness-change lines,
a wind turbine generator and a group of 15 turbine sites,
a reference site,
and also every result WAsP calculated from them: the generalised wind climate, the predicted wind climates and site effects at each site, and the annual energy production (AEP) of the turbines.
We will first import the inputs and the WAsP results as xarray datasets, then repeat the calculation with pywasp and compare the two. Finally, we will use the same inputs to calculate a resource grid over the wind farm.
After importing the necessary libraries, let’s read the wwh file and list its contents:
[1]:
import warnings
warnings.filterwarnings('ignore')  # We will ignore warnings to avoid cluttering the notebook

import matplotlib.pyplot as plt
import numpy as np
import pandas as pd
import windkit as wk
import pywasp as pw
[2]:
wwh = wk.Workspace.read_wwh('./data/import/ssl_default_12_10_0_30.wwh')
wwh
[2]:
WAsP workspace ssl_default_12_10_0_30.wwh (format version 4.01.0006, CRS EPSG:32629)
ID  Object                         Name
 0  WAsP workspace                 ssl_default_12_10_0_30
 1    WAsP project                 Project 1
 2      Turbine site group         Turbine cluster
 3        Turbine site             T1
 4        Turbine site             T2
 5        Turbine site             T3
 6        Turbine site             T4
 7        Turbine site             T5
 8        Turbine site             T6
 9        Turbine site             T7
10        Turbine site             T8
11        Turbine site             T9
12        Turbine site             T10
13        Turbine site             T11
14        Turbine site             T12
15        Turbine site             T13
16        Turbine site             T14
17        Turbine site             T15
18        Reference site           Reference site for the turbine cluster
19      Terrain analysis (IBZ)     Terrain analysis (IBZ) 1
20        Vector map               Serra Santa Luzia
21          Vector map data layer  Serra Santa Luzia
22          Vector map data layer  Serra Santa Luzia
23      Generalised wind climate   GWC
24        Met. station             SerraSantaluzia
25          Observed wind climate  SerraSantaLuzia
26      Wind turbine generator     Bonus 1 MW
27      Reference site             Reference site
The listing shows the WAsP hierarchy as a tree: every object has an ID, its type (the Object column) and the name given to it in WAsP. The first line also tells us the coordinate reference system (CRS) of the workspace, which windkit reads from the header of the vector map. Every dataset we import below is positioned in this CRS, so we don’t need to look up EPSG codes ourselves:
[3]:
print("CRS of the workspace:", wwh.crs)
print("Met. station:", wwh.mast_coords)
CRS of the workspace: 32629
Met. station: {'height': 25.3, 'west_east': 514679.7, 'south_north': 4620970.0, 'description': 'SerraSantaluzia', 'crs': 32629}
Finding objects in the workspace#
Objects are imported by their ID. Instead of reading them off the listing, we can look them up by their type with wwh.get_ids(), which returns a list with the IDs of all objects of that type. This workspace has two reference sites: one in the project and one in the turbine site group. We pick the project’s by its parent in wwh.catalogue:
[4]:
mast_id = wwh.get_ids('Met. station')[0]
group_id = wwh.get_ids('Turbine site group')[0]
turbine_ids = wwh.get_ids('Turbine site')
(ref_id,) = [ID for ID in wwh.get_ids('Reference site') if wwh.catalogue[ID]['ParentID'] != group_id]
print(f"Met. station: {mast_id}, reference site: {ref_id}, turbine site group: {group_id}, turbine sites: {turbine_ids}")
Met. station: 24, reference site: 27, turbine site group: 2, turbine sites: [3, 4, 5, 6, 7, 8, 9, 10, 11, 12, 13, 14, 15, 16, 17]
ID note: the
IDis optional in all thewwh.get_methods we use below. Without it, the method imports the only object of its kind in the workspace, and raises an error listing the candidates if there is more than one. This workspace has a single observed wind climate, map, turbine generator and turbine site group, so most of the calls below could be written without anID. We pass it anyway where it makes the example clearer.
Importing the inputs#
The observed wind climate#
We import the Observed wind climate with wwh.get_owc(). It returns a binned wind climate, positioned at the met station that holds it in the workspace tree. As an exercise, we’ll also export it as a NetCDF file, a format commonly used in meteorological applications and large wind atlases:
[5]:
bwc = wwh.get_owc()
print(bwc)

bwc.to_netcdf('./data/export/bwc.nc')
<xarray.Dataset> Size: 4kB
Dimensions:       (point: 1, sector: 12, wsbin: 32)
Coordinates:
    height        (point) float64 8B 25.3
    south_north   (point) float64 8B 4.621e+06
    west_east     (point) float64 8B 5.147e+05
  * sector        (sector) float64 96B 0.0 30.0 60.0 90.0 ... 270.0 300.0 330.0
    sector_ceil   (sector) float64 96B 15.0 45.0 75.0 ... 285.0 315.0 345.0
    sector_floor  (sector) float64 96B 345.0 15.0 45.0 ... 255.0 285.0 315.0
  * wsbin         (wsbin) float64 256B 0.5 1.5 2.5 3.5 ... 28.5 29.5 30.5 31.5
    wsceil        (wsbin) float64 256B 1.0 2.0 3.0 4.0 ... 29.0 30.0 31.0 32.0
    wsfloor       (wsbin) float64 256B 0.0 1.0 2.0 3.0 ... 28.0 29.0 30.0 31.0
    crs           int8 1B 0
Dimensions without coordinates: point
Data variables:
    wdfreq        (sector, point) float64 96B 0.05314 0.03321 ... 0.1148 0.0707
    wsfreq        (wsbin, sector, point) float64 3kB 0.02601 0.04219 ... 0.0 0.0
Attributes:
    Conventions:      CF-1.8
    history:          2026-10-01T12:51:21+00:00:\twindkit==0.1.0.dev1+g565f93...
    description:      SerraSantaluzia
    Package name:     windkit
    Package version:  0.1.0.dev1+g565f937b5
    Creation date:    2026-10-01T12:51:21+00:00
    Object type:      Binned Wind Climate
    author:           Default User
    author_email:     default_email@example.com
    institution:      Default Institution
The vector map#
The workspace has one Vector map object with two Vector map data layer children: one with the elevation contours and one with the roughness-change lines. In WAsP both are used through the single map object. In pywasp we read them as two separate maps, with wwh.get_elevation_map() and wwh.get_roughness_map(), and bundle them together in a pw.wasp.TopographyMap, which is needed for the flow-perturbation calculations.
wwh.get_roughness_map() can return the roughness map either as polygons (the default) or as roughness-change lines, like WAsP uses. To use the default Polygons is recommended.
[6]:
elev_map = wwh.get_elevation_map()
rough_map = wwh.get_roughness_map()
print(elev_map.head())
print(rough_map.head())

topo_map = pw.wasp.TopographyMap(elev_map, rough_map)
   elev                                           geometry
0   0.1  LINESTRING (512460.3 4637000, 512464.4 4636988...
1   0.1  LINESTRING (515280.7 4608000, 515277.1 4608009...
2   0.1  LINESTRING (517893.5 4616000, 517895.9 4615991...
3   0.1  LINESTRING (516457.4 4616000, 516454.6 4615989...
4   0.1  LINESTRING (515413.3 4616000, 515412.8 4615993...
    id                                           geometry    z0    d desc
0  0.0  POLYGON ((520129.5 4608000, 520157.1 4608018.5...  0.03  0.0
1  0.0  POLYGON ((520157.1 4608018.5, 520129.5 4608000...  0.03  0.0
2  0.0  POLYGON ((522602.4 4608000, 522613.5 4608058, ...  0.03  0.0
3  1.0  POLYGON ((522613.5 4608058, 522602.4 4608000, ...  0.60  0.0
4  1.0  POLYGON ((518024.6 4608000, 518062.3 4608074.5...  0.60  0.0
The wind turbine generator and the turbine sites#
The Wind turbine generator is imported with wwh.get_wtg(), which gives the same dataset as wk.read_wtg does for a .wtg file. The turbine positions and hub heights come from the Turbine site group, with wwh.get_turbines():
[7]:
wtg = wwh.get_wtg()
print(wtg.name.item())

turbines = wwh.get_turbines(group_id)
print(turbines)
Bonus 1 MW
<xarray.Dataset> Size: 481B
Dimensions:      (point: 15)
Coordinates:
    height       (point) float64 120B 50.0 50.0 50.0 50.0 ... 50.0 50.0 50.0
    south_north  (point) float64 120B 4.622e+06 4.622e+06 ... 4.624e+06
    west_east    (point) float64 120B 5.139e+05 5.142e+05 ... 5.163e+05
    crs          int8 1B 0
Dimensions without coordinates: point
Data variables:
    output       (point) float64 120B 0.0 0.0 0.0 0.0 0.0 ... 0.0 0.0 0.0 0.0
Attributes:
    Conventions:  CF-1.8
    history:      2026-10-01T12:51:23+00:00:\twindkit==0.1.0.dev1+g565f937b5\...
The mesoscale climate and the air density#
To generalise a wind climate, WAsP needs the atmospheric stability and baroclinicity of the site, which it looks up in its global mesoscale climate database. Since WAsP 12.8, the workspace stores the values it used. wwh.get_mesoclimate() returns them with the pywasp variable names, so we can pass them straight to pw.wasp.generalize:
[8]:
mesoclimate = wwh.get_mesoclimate()
print(mesoclimate)
<xarray.Dataset> Size: 1kB
Dimensions:               (point: 1, sector: 12)
Coordinates:
    height                (point) float64 8B 25.3
    south_north           (point) float64 8B 4.621e+06
    west_east             (point) float64 8B 5.147e+05
  * sector                (sector) float64 96B 0.0 30.0 60.0 ... 300.0 330.0
    sector_ceil           (sector) float64 96B 15.0 45.0 75.0 ... 315.0 345.0
    sector_floor          (sector) float64 96B 345.0 15.0 45.0 ... 285.0 315.0
    crs                   int8 1B 0
Dimensions without coordinates: point
Data variables:
    mean_temp_scale_land  (sector, point) float64 96B 0.0002808 ... 0.03341
    rms_temp_scale_land   (sector, point) float64 96B 0.04385 0.0403 ... 0.04724
    mean_temp_scale_sea   (sector, point) float64 96B -0.01386 ... -0.001693
    rms_temp_scale_sea    (sector, point) float64 96B 0.04861 ... 0.03138
    mean_pblh_scale_land  (sector, point) float64 96B 900.7 639.9 ... 1.037e+03
    mean_pblh_scale_sea   (sector, point) float64 96B 1.603e+03 ... 1.802e+03
    mean_dgdz             (sector, point) float64 96B 0.007907 ... 0.00851
    mean_dgdz_dir         (sector, point) float64 96B -36.37 15.28 ... -76.17
Attributes:
    Conventions:      CF-1.8
    history:          2026-10-01T12:51:23+00:00:\twindkit==0.1.0.dev1+g565f93...
    Package name:     windkit
    Package version:  0.1.0.dev1+g565f937b5
    Creation date:    2026-10-01T12:51:23+00:00
    author:           Default User
    author_email:     default_email@example.com
    institution:      Default Institution
Likewise, wwh.get_air_density_reference() gives the pressure, temperature and humidity from which WAsP derived the air density at the site:
[9]:
print(wwh.get_air_density_reference())
<xarray.Dataset> Size: 73B
Dimensions:                       (point: 1)
Coordinates:
    height                        (point) float64 8B 25.3
    south_north                   (point) float64 8B 4.621e+06
    west_east                     (point) float64 8B 5.147e+05
    crs                           int8 1B 0
Dimensions without coordinates: point
Data variables:
    source_elevation              (point) float64 8B 127.5
    source_elevation_temperature  (point) float64 8B 129.5
    surface_pressure              (point) float64 8B 1.003e+05
    temperature_celcius           (point) float64 8B 14.55
    relative_humidity             (point) float64 8B 77.42
    lapse_rate                    (point) float64 8B -0.005174
Attributes:
    Conventions:      CF-1.8
    history:          2026-10-01T12:51:23+00:00:\twindkit==0.1.0.dev1+g565f93...
    Package name:     windkit
    Package version:  0.1.0.dev1+g565f937b5
    Creation date:    2026-10-01T12:51:23+00:00
    author:           Default User
    author_email:     default_email@example.com
    institution:      Default Institution
The WAsP parameters#
Finally, wwh.get_parameters() returns the WAsP parameters of every object as a pandas DataFrame, and whether each one still has WAsP’s default value. This workspace was made with default settings, so no parameter differs from its default:
[10]:
parameters = wwh.get_parameters()
print(parameters.head())
print("Parameters that differ from WAsP's default:", len(parameters.query('not `Is default`')))
   Object ID Object description    Source Parameter  Value  Is default
0          1       WAsP project  settings  DSECTORS   12.0        True
1          1       WAsP project  settings   NUMSTDH    5.0        True
2          1       WAsP project  settings   NUMSTDR    5.0        True
3          1       WAsP project  settings     STDH1   10.0        True
4          1       WAsP project  settings     STDH2   25.0        True
Parameters that differ from WAsP's default: 0
Importing the WAsP results#
Besides the inputs, the workspace stores what WAsP calculated from them. These can be imported as well, so they can be analysed in Python or compared with other models.
The generalised wind climate#
We import the Generalised wind climate with wwh.get_gwc(), and export it to NetCDF too:
[11]:
gwc_wasp = wwh.get_gwc()
print(gwc_wasp)

gwc_wasp.to_netcdf('./data/export/gwc.nc')
<xarray.Dataset> Size: 8kB
Dimensions:        (point: 1, gen_height: 5, gen_roughness: 5, sector: 12)
Coordinates:
    height         (point) float64 8B 25.3
    south_north    (point) float64 8B 4.621e+06
    west_east      (point) float64 8B 5.147e+05
  * gen_height     (gen_height) float64 40B 10.0 25.0 50.0 100.0 200.0
  * gen_roughness  (gen_roughness) float64 40B 0.0 0.03 0.1 0.4 1.5
  * sector         (sector) float64 96B 0.0 30.0 60.0 90.0 ... 270.0 300.0 330.0
    sector_ceil    (sector) float64 96B 15.0 45.0 75.0 ... 285.0 315.0 345.0
    sector_floor   (sector) float64 96B 345.0 15.0 45.0 ... 255.0 285.0 315.0
    crs            int8 1B 0
Dimensions without coordinates: point
Data variables:
    A              (gen_height, gen_roughness, sector, point) float64 2kB 5.6...
    k              (gen_height, gen_roughness, sector, point) float64 2kB 1.7...
    wdfreq         (gen_height, gen_roughness, sector, point) float64 2kB 0.0...
Attributes:
    description:      SerraSantaluzia
    Conventions:      CF-1.8
    Package name:     windkit
    Package version:  0.1.0.dev1+g565f937b5
    Creation date:    2026-10-01T12:51:23+00:00
    Object type:      Weibull Wind Climate
    author:           Default User
    author_email:     default_email@example.com
    institution:      Default Institution
    history:          2026-10-01T12:51:23+00:00:\twindkit==0.1.0.dev1+g565f93...
Predicted wind climates and site effects#
wwh.get_wwc() returns the predicted wind climate (the sector-wise Weibull A and k, the sector frequencies and the air density) and wwh.get_site_effects() the site effects (speed-ups, turnings, RIX, mesoscale roughness, …). Both accept the ID of a single site, or of a turbine site group to get one point per turbine site:
[12]:
wwc_ref_wasp = wwh.get_wwc(ref_id)
site_effects_ref_wasp = wwh.get_site_effects(ref_id)
print(wwc_ref_wasp)
<xarray.Dataset> Size: 617B
Dimensions:       (point: 1, sector: 12)
Coordinates:
    height        (point) float64 8B 100.0
    south_north   (point) float64 8B 4.621e+06
    west_east     (point) float64 8B 5.137e+05
    name          (point) object 8B 'Reference site'
  * sector        (sector) float64 96B 0.0 30.0 60.0 90.0 ... 270.0 300.0 330.0
    sector_ceil   (sector) float64 96B 15.0 45.0 75.0 ... 285.0 315.0 345.0
    sector_floor  (sector) float64 96B 345.0 15.0 45.0 ... 255.0 285.0 315.0
    crs           int8 1B 0
Dimensions without coordinates: point
Data variables:
    A             (sector, point) float64 96B 6.809 6.414 5.823 ... 7.166 6.797
    k             (sector, point) float64 96B 2.084 2.346 2.568 ... 2.115 2.002
    wdfreq        (sector, point) float64 96B 0.06475 0.04059 ... 0.08201
    air_density   (point) float64 8B 1.178
Attributes:
    Conventions:      CF-1.8
    history:          2026-10-01T12:51:23+00:00:\twindkit==0.1.0.dev1+g565f93...
    Package name:     windkit
    Package version:  0.1.0.dev1+g565f937b5
    Creation date:    2026-10-01T12:51:23+00:00
    Object type:      Weibull Wind Climate
    author:           Default User
    author_email:     default_email@example.com
    institution:      Default Institution
    description:      WAsP predicted wind climate at reference site 'Referenc...
Several objects in this workspace hold a predicted wind climate (the met station, the reference site and each turbine site), so here the ID is not optional. Calling wwh.get_wwc() without it raises an error that lists the candidates:
[13]:
try:
    wwh.get_wwc()
except ValueError as error:
    print(error)
The workspace holds 19 'Met. station', 'Reference site', 'Turbine site' or 'Turbine site group' objects, so ID must be given. Candidates:
ID  Object              Name
 2  Turbine site group  Turbine cluster
 3  Turbine site        T1
 4  Turbine site        T2
 5  Turbine site        T3
 6  Turbine site        T4
 7  Turbine site        T5
 8  Turbine site        T6
 9  Turbine site        T7
10  Turbine site        T8
11  Turbine site        T9
12  Turbine site        T10
13  Turbine site        T11
14  Turbine site        T12
15  Turbine site        T13
16  Turbine site        T14
17  Turbine site        T15
18  Reference site      Reference site for the turbine cluster
24  Met. station        SerraSantaluzia
27  Reference site      Reference site
Annual energy production#
wwh.get_aep() returns the gross and the potential AEP of the turbine sites in GWh/y. WAsP calls the AEP after wake losses its “net” AEP; in pywasp this is the potential_aep, since further losses are still to be subtracted (see tutorial 6):
[14]:
aep_wasp = wwh.get_aep(group_id)
print(aep_wasp)
print(f"Wind farm gross AEP: {aep_wasp.gross_aep.sum().item():.2f} GWh/y, potential AEP: {aep_wasp.potential_aep.sum().item():.2f} GWh/y")
<xarray.Dataset> Size: 4kB
Dimensions:               (point: 15, sector: 12)
Coordinates:
    height                (point) float64 120B 50.0 50.0 50.0 ... 50.0 50.0 50.0
    south_north           (point) float64 120B 4.622e+06 4.622e+06 ... 4.624e+06
    west_east             (point) float64 120B 5.139e+05 5.142e+05 ... 5.163e+05
    name                  (point) object 120B 'T1' 'T2' 'T3' ... 'T14' 'T15'
  * sector                (sector) float64 96B 0.0 30.0 60.0 ... 300.0 330.0
    sector_ceil           (sector) float64 96B 15.0 45.0 75.0 ... 315.0 345.0
    sector_floor          (sector) float64 96B 345.0 15.0 45.0 ... 285.0 315.0
    crs                   int8 1B 0
Dimensions without coordinates: point
Data variables:
    gross_aep_sector      (sector, point) float64 1kB 0.1428 0.1423 ... 0.2183
    gross_aep             (point) float64 120B 2.796 2.66 2.448 ... 3.063 3.277
    potential_aep_sector  (sector, point) float64 1kB 0.1428 0.1423 ... 0.2183
    potential_aep         (point) float64 120B 2.695 2.568 2.341 ... 2.895 3.157
Attributes:
    Conventions:      CF-1.8
    history:          2026-10-01T12:51:23+00:00:\twindkit==0.1.0.dev1+g565f93...
    Package name:     windkit
    Package version:  0.1.0.dev1+g565f937b5
    Creation date:    2026-10-01T12:51:23+00:00
    Object type:      Anual Energy Production
    author:           Default User
    author_email:     default_email@example.com
    institution:      Default Institution
    description:      WAsP annual energy production at turbine site group 'Tu...
Wind farm gross AEP: 41.64 GWh/y, potential AEP: 40.28 GWh/y
warnings note: we switched off warnings at the start of this notebook, but the result getters warn when WAsP marked results as not up to date (e.g., the inputs were changed after the calculation). Recalculate in WAsP and save the workspace before reading its results. All results in this workspace are up to date.
Anything else: the low-level member data#
The wwh.get_ methods cover what pywasp needs as datasets. Everything else stored for an object can be read from wwh.get_member(), which returns a plain dictionary. For example, the wake model settings of the turbine site group:
[15]:
wake_modelling = wwh.get_member(group_id)['wake_modelling']
print(wake_modelling)
{'is_active': True, 'model': 'Park2', 'n_sub_sectors': 5, 'speed_resolution': np.float64(1.0), 'default_decay_coefficient': np.float64(0.09), 'decay_coefficient': array([0.09, 0.09, 0.09, 0.09, 0.09, 0.09, 0.09, 0.09, 0.09, 0.09, 0.09,
       0.09])}
Repeating the WAsP calculation with pywasp#
We now have all the inputs WAsP used, so let’s repeat its calculation with pywasp and see how the results compare.
The workspace was saved by WAsP 12.10. pywasp’s default configuration, pw.wasp.Config(), uses its WAsP_12.10 parameter set, which reproduces WAsP 12.10. pw.wasp.generalize also defaults to WAsP’s standard generalisation heights, the same heights as the generalised wind climate in the workspace:
[16]:
conf = pw.wasp.Config()

print("Generalisation heights:", gwc_wasp.gen_height.values)
Generalisation heights: [ 10. 25. 50. 100. 200.]
The wind directions of the observed wind climate are measured relative to the grid north of the map, as in WAsP, so we tell pywasp by setting the wind_dir_crs attribute to the CRS of the map. We pass the mesoscale climate from the workspace, so pywasp uses exactly the same stability and baroclinicity as WAsP:
[17]:
bwc.attrs['wind_dir_crs'] = wk.spatial.get_crs(bwc).to_wkt()

gwc = pw.wasp.generalize(bwc, topo_map, conf=conf, mesoclimate=mesoclimate)
At line 555 of file ../../modules/waspcore/Rvea0288/Internal/generalization.f90
Fortran runtime warning: An array temporary was created for argument 'gd' of procedure 'gmom_ntb'
At line 555 of file ../../modules/waspcore/Rvea0288/Internal/generalization.f90
Fortran runtime warning: An array temporary was created for argument 'gf' of procedure 'gmom_ntb'
At line 586 of file ../../modules/waspcore/Rvea0288/Internal/generalization.f90
Fortran runtime warning: An array temporary was created for argument 'gd' of procedure 'gmom_ntb'
At line 586 of file ../../modules/waspcore/Rvea0288/Internal/generalization.f90
Fortran runtime warning: An array temporary was created for argument 'gf' of procedure 'gmom_ntb'
Next we downscale the generalised wind climate to the turbine sites, and calculate their gross AEP and, with WAsP’s wake model settings, their potential AEP. WAsP’s wake model is the PARK2_onshore wind farm model in pywasp:
[18]:
pwc_turbines = pw.wasp.downscale(gwc, topo_map, turbines, conf=conf, return_site_effects=True)

gross_aep = pw.gross_aep(pwc_turbines, wtg, air_density_correction='infer')
potential_aep = pw.potential_aep(
    pwc_turbines,
    wtg,
    air_density_correction='infer',
    wind_farm_model='PARK2_onshore',
    n_subsector=wake_modelling['n_sub_sectors'],
    ws_stepsize=wake_modelling['speed_resolution'],
)
Let’s put the AEP of each turbine from both models side by side:
[19]:
aep_comparison = pd.DataFrame(
    {
        'Gross WAsP': aep_wasp.gross_aep.values,
        'Gross PyWAsP': gross_aep.gross_aep.values,
        'Potential WAsP': aep_wasp.potential_aep.values,
        'Potential PyWAsP': potential_aep.potential_aep.values,
    },
    index=aep_wasp.name.values,
)
aep_comparison.loc['Wind farm'] = aep_comparison.sum()
aep_comparison.round(4)
[19]:
| Gross WAsP | Gross PyWAsP | Potential WAsP | Potential PyWAsP | |
|---|---|---|---|---|
| T1 | 2.7958 | 2.7957 | 2.6951 | 2.6950 |
| T2 | 2.6601 | 2.6600 | 2.5682 | 2.5682 |
| T3 | 2.4484 | 2.4483 | 2.3408 | 2.3407 |
| T4 | 2.5325 | 2.5325 | 2.4229 | 2.4229 |
| T5 | 2.6970 | 2.6970 | 2.5877 | 2.5877 |
| T6 | 2.7743 | 2.7743 | 2.7290 | 2.7289 |
| T7 | 2.6528 | 2.6528 | 2.6219 | 2.6218 |
| T8 | 2.9498 | 2.9497 | 2.8987 | 2.8987 |
| T9 | 3.0417 | 3.0417 | 2.9793 | 2.9792 |
| T10 | 2.2840 | 2.2840 | 2.2102 | 2.2102 |
| T11 | 2.6803 | 2.6802 | 2.6201 | 2.6201 |
| T12 | 2.9138 | 2.9138 | 2.8259 | 2.8258 |
| T13 | 2.8710 | 2.8709 | 2.7241 | 2.7241 |
| T14 | 3.0630 | 3.0629 | 2.8948 | 2.8948 |
| T15 | 3.2769 | 3.2768 | 3.1568 | 3.1568 |
| Wind farm | 41.6413 | 41.6407 | 40.2755 | 40.2749 |
The two models agree to within a few thousandths of a percent, both for the individual turbines and for the whole wind farm.
Calculating a resource grid over the wind farm#
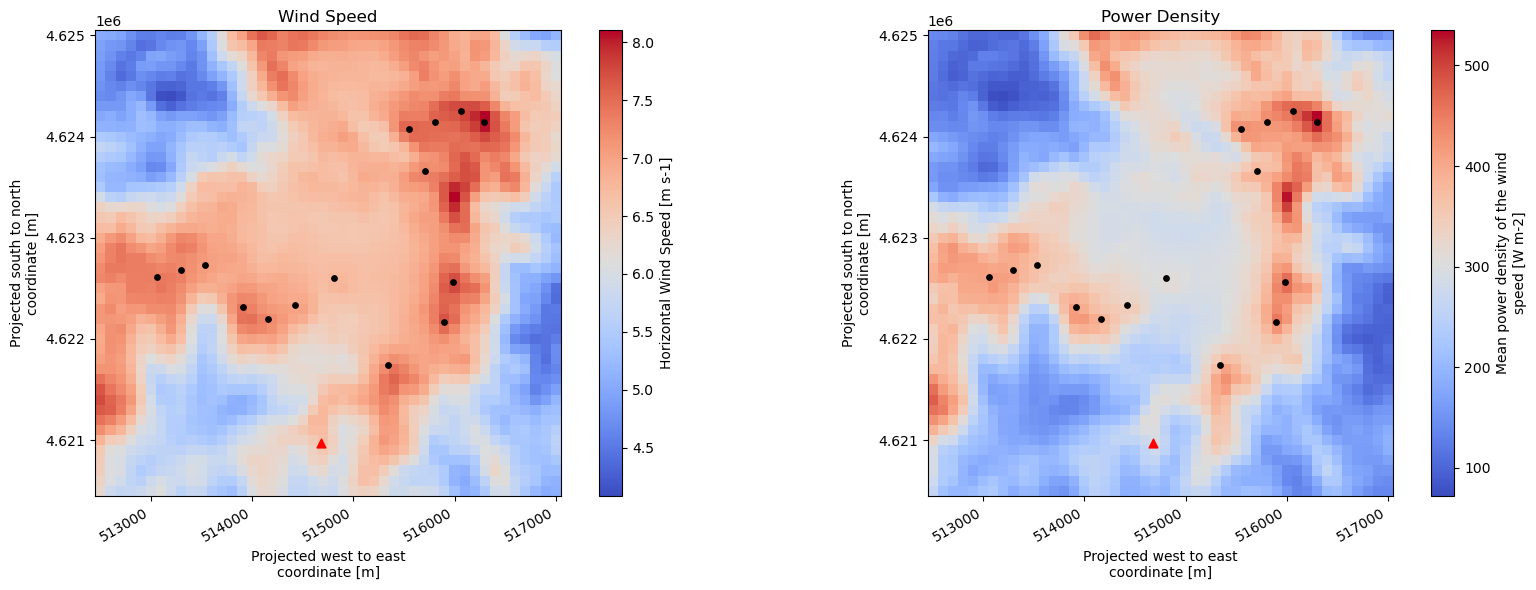
With the inputs from the workspace we are not limited to the sites defined in WAsP. Let’s create a uniform grid with a resolution of 100 m around the turbines, at their hub height of 50 m, and downscale the generalised wind climate to it:
[20]:
height = 50
res = 100

output_locs = wk.spatial.create_dataset(
    np.arange(512500, 517000 + res, res),
    np.arange(4620500, 4625000 + res, res),
    np.array([height]),
    wwh.crs,
)

pwc_grid = pw.wasp.downscale(gwc, topo_map, output_locs, conf=conf)
print(pwc_grid)

pwc_grid.to_netcdf(f'./data/export/results_{height}_m.nc')
<xarray.Dataset> Size: 340kB
Dimensions:        (sector: 12, height: 1, south_north: 46, west_east: 46)
Coordinates:
  * sector         (sector) float64 96B 0.0 30.0 60.0 90.0 ... 270.0 300.0 330.0
    sector_ceil    (sector) float64 96B 15.0 45.0 75.0 ... 285.0 315.0 345.0
    sector_floor   (sector) float64 96B 345.0 15.0 45.0 ... 255.0 285.0 315.0
  * height         (height) int64 8B 50
  * south_north    (south_north) int64 368B 4620500 4620600 ... 4624900 4625000
  * west_east      (west_east) int64 368B 512500 512600 512700 ... 516900 517000
    crs            int8 1B 0
Data variables:
    A              (sector, height, south_north, west_east) float32 102kB 4.6...
    k              (sector, height, south_north, west_east) float32 102kB 2.0...
    wdfreq         (sector, height, south_north, west_east) float32 102kB 0.0...
    site_elev      (south_north, west_east) float32 8kB 199.8 194.9 ... 252.1
    air_density    (height, south_north, west_east) float32 8kB 1.194 ... 1.187
    wspd           (height, south_north, west_east) float32 8kB 6.238 ... 5.179
    power_density  (height, south_north, west_east) float32 8kB 262.7 ... 160.1
Attributes:
    Conventions:      CF-1.8
    history:          2026-10-01T12:51:25+00:00:\twindkit==0.1.0.dev1+g565f93...
    title:            WAsP site effects
    Package name:     windkit
    Package version:  0.1.0.dev1+g565f937b5
    Creation date:    2026-10-01T12:51:45+00:00
    Object type:      Met fields
    author:           Default User
    author_email:     default_email@example.com
    institution:      Default Institution
And plot the mean wind speed and power density, with the turbine sites (black) and the met station (red) on top:
[21]:
fig, axes = plt.subplots(1, 2, figsize=(17, 6))
ax1, ax2 = axes.flat
variables = ['wspd', 'power_density']
for var, ax in zip(variables, axes.flat):
    pwc_grid[var].isel(height=0).plot(ax=ax, cmap='coolwarm')
    ax.scatter(turbines.west_east, turbines.south_north, c='k', s=15)
    ax.scatter(bwc.west_east, bwc.south_north, c='r', marker='^', s=40)
    ax.set_aspect('equal')
    plt.setp(ax.get_xticklabels(), rotation=30, horizontalalignment='right')
ax1.set_title("Wind Speed")
ax2.set_title("Power Density")
fig.tight_layout()