

Map Conversion examples#
Windkit stores vector maps as GeoDataFrames in one of two representations:
Change-line maps: lines with the landcover id (or roughness length) on each side of the line, stored in
id_left/id_right(orz0_left/z0_right) columns. This is the traditional WAsP.maprepresentation.Polygon maps: polygons with a single
id(orz0) column. This is the representation used by GIS formats and returned bywindkit.read_landcover_mapby default.
Two functions convert between them:
windkit.lines_to_polygons— convert a change-line map to a polygon mapwindkit.polygons_to_lines— convert a polygon map to a change-line map
[1]:
import geopandas as gpd
from shapely.geometry import LineString, Polygon

import windkit as wk

%matplotlib inline
Lines to polygons#
Let us use some basic data. We can simulate a simple map using shapely and GeoPandas. The resulting GeoDataFrame contains lines and the ids of the areas on their left and on their right.
[2]:
geo = [
    LineString([(0, 0), (0, 1.5)]),
    LineString([(0, 1.5), (1, 0)]),
    LineString([(1, 0), (0, 0)]),
    LineString([(0, 0), (-2, 0)]),
    LineString([(0, 1.5), (-2, 2)]),
    LineString([(1, 0), (2, -2)]),
    LineString([(-2, -1.5), (-1.5, -1.5), (-1, -2.5), (-2, -2)]),
    LineString([(-1, -2), (1, -2), (0, -1), (-1, -2)]),
]
id_left = [2, 1, 3, 3, 2, 1, 3, 5]
id_right = [0, 0, 0, 2, 1, 3, 4, 3]
lines = gpd.GeoDataFrame(
    {"geometry": geo, "id_left": id_left, "id_right": id_right}, crs="EPSG:32632"
)
lines.plot()
lines
[2]:
| geometry | id_left | id_right | |
|---|---|---|---|
| 0 | LINESTRING (0 0, 0 1.5) | 2 | 0 |
| 1 | LINESTRING (0 1.5, 1 0) | 1 | 0 |
| 2 | LINESTRING (1 0, 0 0) | 3 | 0 |
| 3 | LINESTRING (0 0, -2 0) | 3 | 2 |
| 4 | LINESTRING (0 1.5, -2 2) | 2 | 1 |
| 5 | LINESTRING (1 0, 2 -2) | 1 | 3 |
| 6 | LINESTRING (-2 -1.5, -1.5 -1.5, -1 -2.5, -2 -2) | 3 | 4 |
| 7 | LINESTRING (-1 -2, 1 -2, 0 -1, -1 -2) | 5 | 3 |
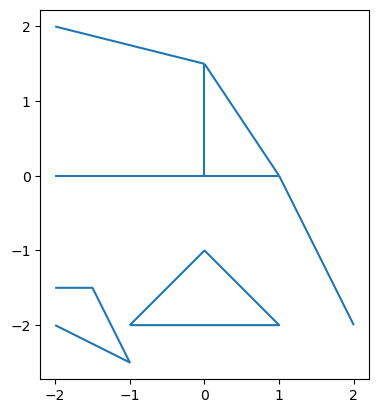
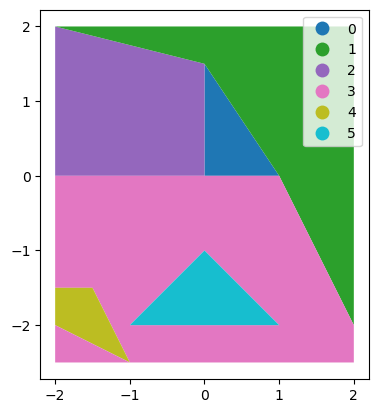
We can transform the data to a polygon map with windkit.lines_to_polygons. The resulting GeoDataFrame contains the polygons and their id. The map is automatically closed at the bounding box of the input lines, so lines that do not end on another line are extended to the map border.
[3]:
polygons = wk.lines_to_polygons(lines)
polygons["id"] = polygons["id"].astype(int)
polygons
[3]:
| geometry | id | |
|---|---|---|
| 0 | POLYGON ((0 0, 0 1.5, 1 0, 0 0)) | 0 |
| 1 | POLYGON ((0 1.5, 0 0, -2 0, -2 2, 0 1.5)) | 2 |
| 2 | POLYGON ((1 0, 0 1.5, -2 2, 2 2, 2 -2, 1 0)) | 1 |
| 3 | POLYGON ((0 0, 1 0, 2 -2, 2 -2.5, -1 -2.5, -1.... | 3 |
| 4 | POLYGON ((-2 -1.5, -1.5 -1.5, -1 -2.5, -2 -2, ... | 4 |
| 5 | POLYGON ((-2 -2, -1 -2.5, -2 -2.5, -2 -2)) | 3 |
| 6 | POLYGON ((-1 -2, 0 -1, 1 -2, -1 -2)) | 5 |
[4]:
polygons.plot(column="id", categorical=True, legend=True)
[4]:
<Axes: >
If you are unsure about the quality of your change-line map, you can pass check_errors=True to raise an error when lines cross each other or end in free space (dead ends). The checks are also available directly as windkit.check_lines_cross and windkit.check_dead_ends. In this toy map the lines that are extended to the map border count as dead ends; with errors="ignore" and add_errors=True we get a boolean column marking them instead of an error.
[5]:
_ = wk.check_lines_cross(lines, errors="raise")
wk.check_dead_ends(lines, errors="ignore", add_errors=True)
[5]:
| geometry | id_left | id_right | dead_end | |
|---|---|---|---|---|
| 0 | LINESTRING (0 0, 0 1.5) | 2 | 0 | False |
| 1 | LINESTRING (0 1.5, 1 0) | 1 | 0 | False |
| 2 | LINESTRING (1 0, 0 0) | 3 | 0 | False |
| 3 | LINESTRING (0 0, -2 0) | 3 | 2 | True |
| 4 | LINESTRING (0 1.5, -2 2) | 2 | 1 | True |
| 5 | LINESTRING (1 0, 2 -2) | 1 | 3 | True |
| 6 | LINESTRING (-2 -1.5, -1.5 -1.5, -1 -2.5, -2 -2) | 3 | 4 | True |
| 7 | LINESTRING (-1 -2, 1 -2, 0 -1, -1 -2) | 5 | 3 | False |
Adding a landcover table#
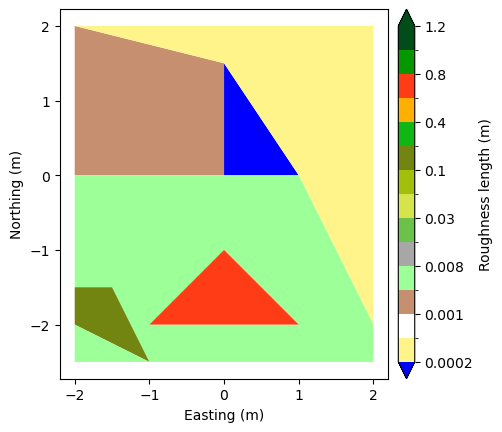
A landcover polygon map only stores ids; the mapping from id to roughness length z0 (and displacement height d) lives in a windkit.LandCoverTable. With windkit.add_landcover_table we can join the table onto the polygons to get their z0, d, and desc values.
[6]:
lctable = wk.LandCoverTable(
    {
        0: dict(z0=0.0, d=0.0, desc="Water"),
        1: dict(z0=0.0002, d=0.0, desc="Sand"),
        2: dict(z0=0.001, d=0.0, desc="Bare soil"),
        3: dict(z0=0.005, d=0.0, desc="Mown grass"),
        4: dict(z0=0.1, d=0.0, desc="Shrubs"),
        5: dict(z0=0.5, d=0.0, desc="Forest"),
    }
)
polygons_lc = wk.add_landcover_table(polygons, lctable)
polygons_lc
[6]:
| id | geometry | z0 | d | desc | |
|---|---|---|---|---|---|
| 0 | 0 | POLYGON ((0 0, 0 1.5, 1 0, 0 0)) | 0.0000 | 0.0 | Water |
| 1 | 2 | POLYGON ((0 1.5, 0 0, -2 0, -2 2, 0 1.5)) | 0.0010 | 0.0 | Bare soil |
| 2 | 1 | POLYGON ((1 0, 0 1.5, -2 2, 2 2, 2 -2, 1 0)) | 0.0002 | 0.0 | Sand |
| 3 | 3 | POLYGON ((0 0, 1 0, 2 -2, 2 -2.5, -1 -2.5, -1.... | 0.0050 | 0.0 | Mown grass |
| 4 | 4 | POLYGON ((-2 -1.5, -1.5 -1.5, -1 -2.5, -2 -2, ... | 0.1000 | 0.0 | Shrubs |
| 5 | 3 | POLYGON ((-2 -2, -1 -2.5, -2 -2.5, -2 -2)) | 0.0050 | 0.0 | Mown grass |
| 6 | 5 | POLYGON ((-1 -2, 0 -1, 1 -2, -1 -2)) | 0.5000 | 0.0 | Forest |
With the roughness lengths in place, windkit.plot.landcover_map plots the map with the same roughness color scheme that is used in QGIS.
[7]:
_ = wk.plot.landcover_map(polygons_lc)
Polygons to lines#
We can convert the polygon map back to change lines with windkit.polygons_to_lines. For a landcover map we pass the landcover table and set map_type="landcover" to get id_left/id_right change lines; with the default map_type="roughness" the lines get z0_left/z0_right columns instead. Setting return_lctable=True also returns the landcover table that belongs to the lines.
[8]:
lines_back, lctable_back = wk.polygons_to_lines(
    polygons_lc, lctable=lctable, map_type="landcover", return_lctable=True
)
lines_back.plot()
lines_back
[8]:
| id_left | id_right | geometry | |
|---|---|---|---|
| 0 | 0 | 1 | LINESTRING (1 0, 0 1.5) |
| 1 | 0 | 2 | LINESTRING (0 1.5, 0 0) |
| 2 | 0 | 3 | LINESTRING (0 0, 1 0) |
| 3 | 1 | 3 | LINESTRING (1 0, 2 -2) |
| 4 | 2 | 1 | LINESTRING (0 1.5, -2 2) |
| 5 | 2 | 3 | LINESTRING (-2 0, 0 0) |
| 6 | 3 | 4 | LINESTRING (-2 -1.5, -1.5 -1.5, -1 -2.5) |
| 7 | 3 | 5 | LINESTRING (-1 -2, 0 -1, 1 -2, -1 -2) |
| 8 | 4 | 3 | LINESTRING (-2 -2, -1 -2.5) |
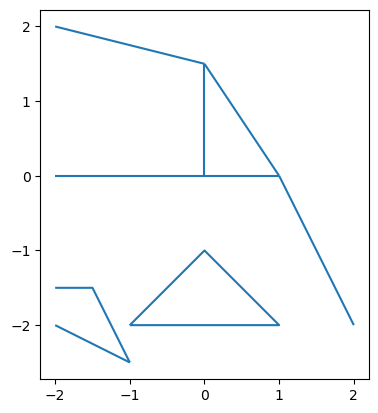
Note that the lines along the map border are not part of the output: outside the outermost polygons the landcover is undefined, so no change line is drawn there.
Maps that do not cover the whole domain#
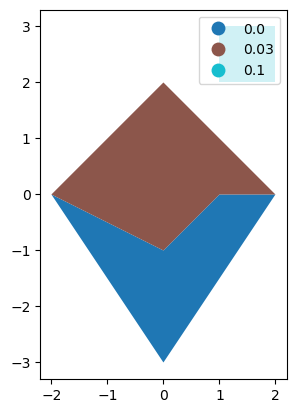
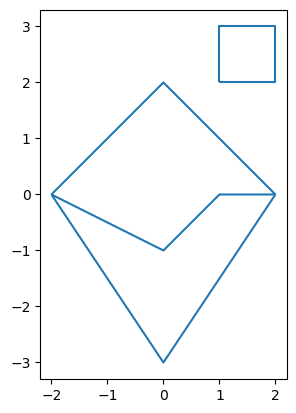
If the polygons do not tile the full map area, the white space between them has no landcover, and windkit.polygons_to_lines raises an error. In that case you can pass external_roughness — the roughness length to use for all areas that are not covered by a polygon. An extra landcover class is added for it, and a warning reminds you that any holes in the map are filled with this roughness value.
[9]:
points = [
    [(-2, 0), (0, -3), (2, 0), (1, 0), (0, -1)],
    [(2, 0), (1, 0), (0, -1), (-2, 0), (0, 2)],
    [(1, 2), (1, 3), (2, 3), (2, 2)],
]
sparse_polygons = gpd.GeoDataFrame(
    {"geometry": [Polygon(p) for p in points], "z0": [0.0, 0.03, 0.1]},
    crs="EPSG:32632",
)
sparse_polygons.plot(column="z0", categorical=True, legend=True)
[9]:
<Axes: >
[10]:
sparse_lines = wk.polygons_to_lines(sparse_polygons, external_roughness=0.4)
sparse_lines.plot()
sparse_lines
/builds/ram/software/pywasp/windkit/windkit/topography/_vectormap_helpers.py:413: UserWarning: There is holes in your map. The area specified by the outer boundary of your polygons (the convex hull) is not the same as the sum of the areas of the polygons. These areas will get the roughness length specified by external_roughness, even though they are not at the edge of the map.
  warnings.warn(
[10]:
| geometry | z0_left | z0_right | |
|---|---|---|---|
| 0 | LINESTRING (2 0, 1 0, 0 -1, -2 0) | 0.00 | 0.03 |
| 1 | LINESTRING (-2 0, 0 -3, 2 0) | 0.00 | 0.40 |
| 2 | LINESTRING (2 0, 0 2, -2 0) | 0.03 | 0.40 |
| 3 | LINESTRING (1 2, 2 2, 2 3, 1 3, 1 2) | 0.10 | 0.40 |
Snapping polygons#
Sometimes adjacent polygons do not share vertices, i.e. a point appears in one polygon but not on the neighboring polygon. In the map below the two polygons touch along the line from (1, 0) to (1, 0.5), but the left polygon has no vertices at (1, 0.5), so their boundary segments do not match up.
[11]:
poly_a = Polygon([(0, 0), (1, 0), (1, 1), (0, 1)])
poly_b = Polygon([(1, 0), (2, 0), (2, 0.5), (1, 0.5)])
touching = gpd.GeoDataFrame(
    {"geometry": [poly_a, poly_b], "z0": [0.03, 0.4]}, crs="EPSG:32632"
)
touching.plot(column="z0", categorical=True, legend=True)
[11]:
<Axes: >
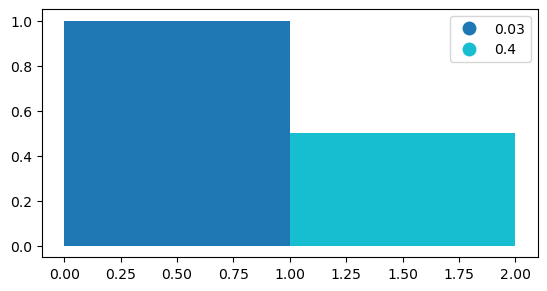
If we convert this map with snap=False, the change line between the two polygons is lost: each polygon is only bordered by the external roughness.
[12]:
wk.polygons_to_lines(touching, external_roughness=0.0, snap=False)
[12]:
| geometry | z0_left | z0_right | |
|---|---|---|---|
| 0 | LINESTRING (0 0, 1 0, 1 1, 0 1, 0 0) | 0.03 | 0.0 |
| 1 | LINESTRING (1 0, 2 0, 2 0.5, 1 0.5, 1 0) | 0.40 | 0.0 |
With the default snap=True, extra vertices are inserted so that touching polygons share vertices, and the change line between the two polygons (with roughness 0.03 on the left and 0.4 on the right) is recovered.
[13]:
wk.polygons_to_lines(touching, external_roughness=0.0)
[13]:
| geometry | z0_left | z0_right | |
|---|---|---|---|
| 0 | LINESTRING (1 0, 1 0.5) | 0.03 | 0.4 |
| 1 | LINESTRING (1 0.5, 1 1, 0 1, 0 0, 1 0) | 0.03 | 0.0 |
| 2 | LINESTRING (1 0, 2 0, 2 0.5, 1 0.5) | 0.40 | 0.0 |
The snapping is also available directly as windkit.snap_to_layer, which returns the polygons with the inserted vertices. Points are moved at most tolerance map units to snap them to a neighboring polygon.
[14]:
snapped = wk.snap_to_layer(touching, tolerance=0.1)
snapped.geometry.to_wkt().to_list()
[14]:
['POLYGON ((0 0, 1 0, 1 0.5, 1 1, 0 1, 0 0))',
 'POLYGON ((1 0, 2 0, 2 0.5, 1 0.5, 1 0))']