Topography
Topographic information is an important input to WAsP’s flow models. Specifically, WAsP’s terrain model takes as input maps of surface elevation, surface roughness, and optionally displacement height.
In PyWAsP, instead of dealing with surface roughness maps and displacement height maps as completely separate layers, we deal with them as land cover maps, where patches of land are associated with specific land cover classes, each having specific surface characteristics (i.e. the surface roughness and displacement height).
Maps in the forms of rasters or vectors of surface roughness can be read by WindKit, but are converted directly to land cover classes and an associated look-up table of surface characteristics.
To start working with topographic data, we will import xarray, matplotlib, windkit, and pywasp.
In [1]: import xarray as xr

In [2]: import matplotlib.pyplot as plt

In [3]: import windkit as wk

In [4]: import pywasp as pw
Topography I/O
Reading and writing topography files is handled by WindKit. Currently, windkit supports the following file formats:
Format |
Raster/Vector |
Read |
Write |
|---|---|---|---|
|
Raster |
yes |
yes |
|
Raster |
yes |
yes |
|
Raster |
yes |
yes |
|
Vector |
yes |
yes |
|
Vector |
yes |
yes |
|
Vector |
yes |
yes |
- All elevation maps are read and written using:
windkit.read_elevation_map()windkit.elevation_map_to_file().
- Similarly, roughness and landcover maps are read and written using:
windkit.read_roughness_map()windkit.roughness_map_to_file().windkit.read_landcover_map()windkit.landcover_map_to_file().
Raster Maps
To start, let’s read some raster elevation data. The data covers part of the west coast of Jutland, Denmark:
In [5]: elev_map_raster = wk.read_elevation_map(
   ...:     "source/tutorials/data/elev.tif",
   ...: )
   ...:

In [6]: print(elev_map_raster)
<xarray.DataArray 'elevation' (south_north: 800, west_east: 800)> Size: 5MB
[640000 values with dtype=float64]
Coordinates:
  * west_east    (west_east) float64 6kB 7.818 7.818 7.819 ... 8.482 8.483 8.483
  * south_north  (south_north) float64 6kB 56.11 56.11 56.11 ... 56.77 56.77
    crs          int64 8B 0
Attributes:
    description:    height above sea level of a point on the surface of an or...
    long_name:      Terrain Elevation
    standard_name:  ground_level_altitude
    units:          m
    grid_mapping:   crs
    history:        2025-07-22T14:11:19+00:00:\twindkit==1.0.3.dev1+ga612767\...
Since the data is a xr.DataArray it is easy to visualize:
In [7]: elev_map_raster.plot(cmap="viridis", vmin=0.0, vmax=60.0);
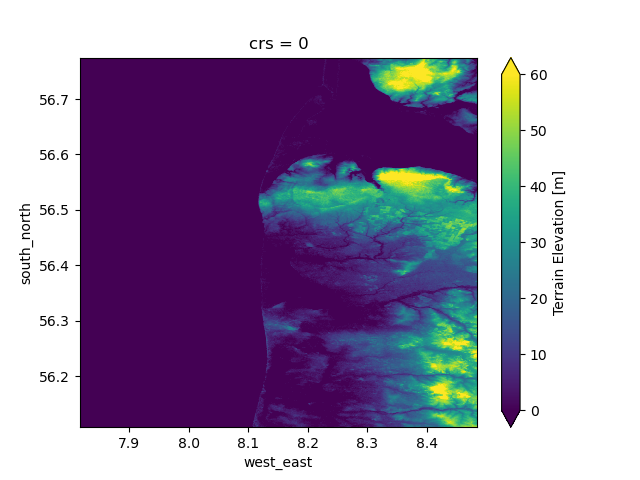
The raster is in latitude-longitude projection (EPSG:4326).
To reproject the data to a new raster in UTM coordinates, windkit.spatial.warp() can be used:
In [8]: elev_map_raster = wk.spatial.warp(elev_map_raster, to_crs="EPSG:25832", method="cubic")

In [9]: elev_map_raster.plot(cmap="viridis", vmin=0.0, vmax=60.0);
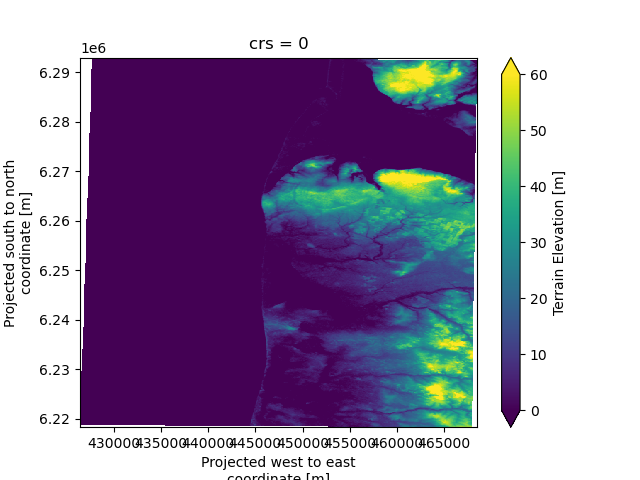
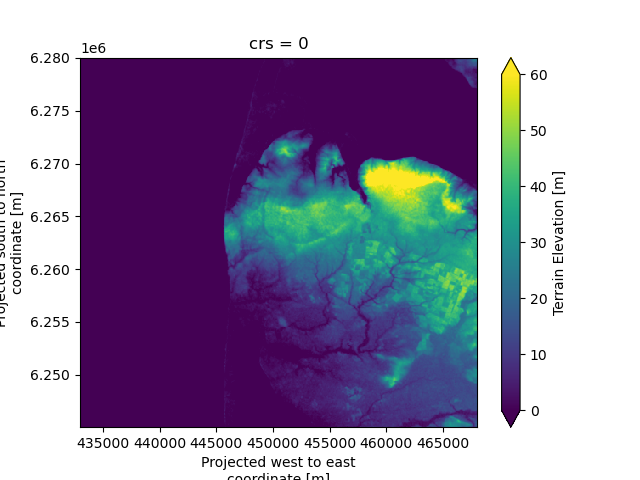
Warping to a new raster can create cells with missing data along the edges, so to clip the raster to only include real data, we will create a bounding box and clip to its bounds:
In [10]: bbox = wk.spatial.BBox.from_cornerpts(
   ....:     minx=433_000,
   ....:     miny=6_245_000.0,
   ....:     maxx=468_000,
   ....:     maxy=6_280_000,
   ....:     crs="EPSG:25832"
   ....: )
   ....:

In [11]: elev_map_raster = wk.spatial.clip(elev_map_raster, bbox)

In [12]: elev_map_raster.plot(cmap="viridis", vmin=0.0, vmax=60.0);
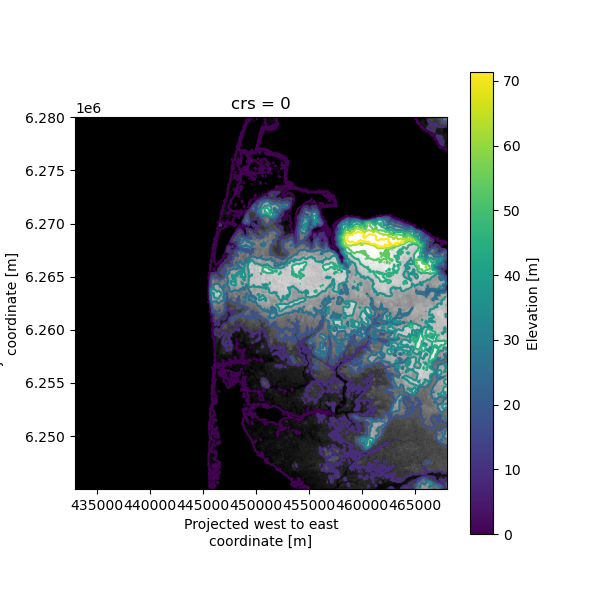
While WindKit and PyWAsP have great support for working with both raster and vector maps and the PyWAsP
terrain model can work with elevation maps as both rasters and vector maps, for land cover maps PyWAsP expects
vector maps as input. Therefore, PyWAsP enables conversion from raster maps to vector maps, through the
pywasp.raster_to_vector() function.
In [13]: elev_map_vector = pw.raster_to_vector(elev_map_raster)

In [14]: fig, ax = plt.subplots(1, 1, figsize=(6, 6))

In [15]: elev_map_raster.plot(ax=ax, cmap="Greys_r", vmin=0.0, vmax=60.0, add_colorbar=False)

In [16]: elev_map_vector.plot("elev", ax=ax, legend=True, legend_kwds={"label": "Elevation [m]"});
Vector Maps
To further illustrate how to work with vector maps, let’s read some land cover data from the Serra Santa Luzia site.
Since the data comes in a .map, which does not hold information about the
coordinate reference system, and, because it can hold both roughness and elevation information, we
have to provide the crs value and ask for the “roughness” part of the data via the map_type="roughness" argument.
Remember, the roughness map is converted to land cover classes by windkit.
In [17]: lc_map_vector, lc_tbl = wk.read_roughness_map(
   ....:     "source/tutorials/data/SerraSantaLuzia.map",
   ....:     crs="EPSG:32629",
   ....:     convert_to_landcover=True,
   ....:     polygons=False
   ....: )
   ....:

In [18]: print(lc_map_vector)
                                              geometry  id_left  id_right
0    LINESTRING (520129.5 4608000, 520157.1 4608018.5)        0         0
1      LINESTRING (522602.4 4608000, 522613.5 4608058)        1         0
2    LINESTRING (518024.6 4608000, 518062.3 4608074.5)        0         1
3    LINESTRING (518062.3 4608074.5, 518160.5 46081...        1         1
4    LINESTRING (522376.2 4608000, 522411.7 4608066...        2         1
..                                                 ...      ...       ...
889  LINESTRING (524303.3 4637000, 524300.4 4636988...        0         1
890  LINESTRING (519338 4636768, 519331.3 4636784.5...        3         0
891  LINESTRING (510688.6 4635512, 510675.5 4635315...        4         9
892  LINESTRING (510166.2 4637000, 510167.2 4636997...        1         9
893  LINESTRING (526903.9 4637000, 526904.1 4636978...        1         1

[894 rows x 3 columns]
Vector maps are geopandas.GeoDataFrame objects with shapely.LineString geometries associated with either land cover boundaries or elevation levels.
Here, we have just two columns of data, the geometry column (for the shapely.LineString’s’) and the elevation column “elev”.
Since vector maps are geopandas.GeoDataFrame objects, they are easy to inspect and plot.
To avoid too much clutter, we will only plot lines where some specific classes are present (ocean and one forest category):
In [19]: fig, ax = plt.subplots(1, 1, figsize=(6, 6))

In [20]: ax.set_facecolor("black")

In [21]: cats = [3, 4]

In [22]: mask = lc_map_vector.id_left.isin(cats) | lc_map_vector.id_right.isin(cats)

In [23]: lc_map_vector.loc[mask].plot(
   ....:     "id_left",
   ....:     cmap="tab20",
   ....:     vmin=-0.5,
   ....:     vmax=19.5,
   ....:     linewidth=2,
   ....:     ax=ax
   ....: );
   ....:

In [24]: lc_map_vector.loc[mask].plot(
   ....:     "id_right",
   ....:     cmap="tab20",
   ....:     vmin=-0.5,
   ....:     vmax=19.5,
   ....:     ax=ax,
   ....:     linewidth=1,
   ....:     linestyle="--",
   ....:     legend=True,
   ....:     legend_kwds={"label": "Land cover category", "ticks": list(range(13))},
   ....: );
   ....:
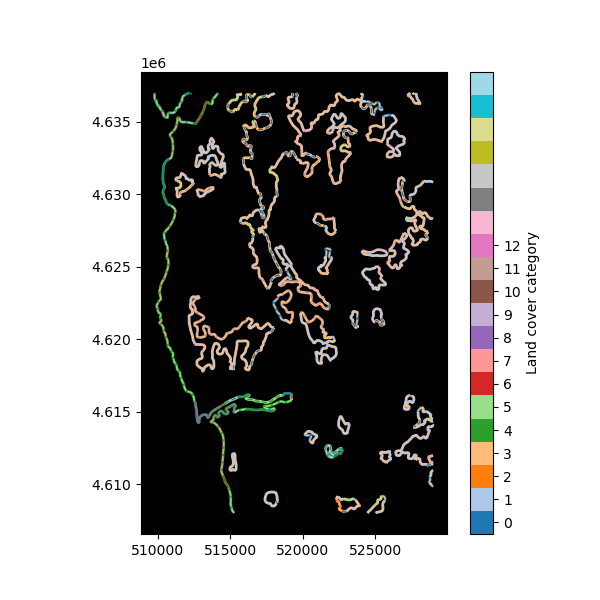
The way we plot the roughness-change lines, each line has two colors: the index for the “left” and “right” land cover category. The lines represent jumps from one type of land cover to another. The land cover table holds the information about the classes and their associated surface roughnesses and displacement heights:
In [25]: print(lc_tbl)
id = LandCoverID
z0 = Roughness length (m)
d = Displacement height (m)
desc = Description
id	z0	d	desc
0	0.0300	0.0
1	0.6000	0.0
2	0.7000	0.0
3	0.9000	0.0
4	0.0000	0.0
5	0.1000	0.0
6	1.5000	0.0
7	0.0100	0.0
8	0.5000	0.0
9	0.0500	0.0
10	0.3000	0.0
11	0.2000	0.0
12	0.8000	0.0
Preparing Input for Terrain Modeling
To predict site effects from the Topography data with PyWAsP, the data is bundled together
in the pywasp.wasp.TopographyMap PyWAsP class object.
It takes as input an elevation vector map, a land cover vector map, and a land cover table, as input.
In [26]: elev_map_vector = wk.read_elevation_map(
   ....:     "source/tutorials/data/SerraSantaLuzia.map",
   ....:     crs="EPSG:32629",
   ....: )
   ....:

In [27]: topo_map = pw.wasp.TopographyMap(
   ....:     elev_map_vector,
   ....:     lc_map_vector,
   ....:     lc_tbl
   ....: )
   ....:

In [28]: print(topo_map)
Roughness map
                                              geometry  id_left  id_right
0    LINESTRING (520129.5 4608000, 520157.1 4608018.5)        0         0
1      LINESTRING (522602.4 4608000, 522613.5 4608058)        1         0
2    LINESTRING (518024.6 4608000, 518062.3 4608074.5)        0         1
3    LINESTRING (518062.3 4608074.5, 518160.5 46081...        1         1
4    LINESTRING (522376.2 4608000, 522411.7 4608066...        2         1
..                                                 ...      ...       ...
889  LINESTRING (524303.3 4637000, 524300.4 4636988...        0         1
890  LINESTRING (519338 4636768, 519331.3 4636784.5...        3         0
891  LINESTRING (510688.6 4635512, 510675.5 4635315...        4         9
892  LINESTRING (510166.2 4637000, 510167.2 4636997...        1         9
893  LINESTRING (526903.9 4637000, 526904.1 4636978...        1         1

[894 rows x 3 columns]
Elevation map
      elev                                           geometry
0      0.1  LINESTRING (512460.3 4637000, 512464.4 4636988...
1      0.1  LINESTRING (515280.7 4608000, 515277.1 4608009...
2      0.1  LINESTRING (517893.5 4616000, 517895.9 4615991...
3      0.1  LINESTRING (516457.4 4616000, 516454.6 4615989...
4      0.1  LINESTRING (515413.3 4616000, 515412.8 4615993...
..     ...                                                ...
577  510.0  LINESTRING (515924.7 4623250, 515919.1 4623258...
578  520.0  LINESTRING (515950.9 4623300, 515944.4 4623306...
579  520.0  LINESTRING (516082 4623650, 516074.8 4623655.5...
580  520.0  LINESTRING (515674.8 4623925, 515667 4623931.5...
581  530.0  LINESTRING (515972.6 4623375, 515967.8 4623382...

[582 rows x 2 columns]
Topography maps can be saved to, and loaded from, a ZipFile archive using the pywasp.wasp.TopographyMap.save() and pywasp.wasp.TopographyMap.load() methods.
In WAsP Flow Model we describe the WAsP models in more details and show how terrain effects can be calculated
from a topo_map, like the one above.
Best practices for working with roughness maps
Roughness maps can come from many different sources and can be of varying quality and resolution. When working with roughness maps, it is important to consider the following best practices for making them suitable for use in WAsP:
- Water bodies have 0.0 roughness: Water bodies should have a roughness value of 0.0, this is the signal to WAsP that the surface is water.
During calculations in WAsP, the roughness value of 0.0 is replaced with the water roughness value set in the
pw.wasp.Config(default is 0.0002). This is important for the stability model of WAsP, as it uses different stability functions for water and land.
- Land roughness values should be in the range [0.0002, 5.0]: Roughness values should be in the range [0.0002, 5.0] for land surfaces.
WAsP assumes the lowest roughness to be the water roughness value (0.0002) and the highest roughness to be 5.0. Any land roughness values outside this range can cause problems in WAsP. If a lower water roughness value was set in the WAsP Config, the lower limit is adjusted accordingly.
- Keep the number of unique roughness values to a reasonable number: WindKit reads roughness maps and converts them to land cover classes.
The number of unique roughness values in the roughness map should be kept to a reasonable number to avoid too many land cover classes. The suitable number of unique roughness values depends on the application. PyWAsP allows up to 100, but typically 5-50 unique roughness values are sufficient. Internally, WAsP uses a limited number of roughness-change events per sector, so having too many unique roughness values dont add any value.
In the future, WindKit will provide tools to preprocess roughness maps to adhere to these best practices. In the meantime, QGIS, xarray, xarray-spatial, and other GIS tools can be used.