Wind Climates
In PyWAsP’s Terminology and Data Structures
sections we outlined how we define the meaning and data structures of different kinds of wind climate objects.
Here we present how common wind climate workflows can be carried out. PyWAsP relies heavily on WindKit
for a lot of this functionality, so to illustrate it let’s start by importing windkit, pywasp and xarray.
In [1]: import pywasp as pw

In [2]: import windkit as wk

In [3]: import xarray as xr
Wind climate I/O
Reading and writing wind climates is a core part of WindKit
Format |
Wind Climate |
Read |
Write |
|---|---|---|---|
|
BWC, GWC, WWC |
yes |
yes |
|
BWC |
yes |
yes |
|
BWC |
yes |
no |
|
BWC |
yes |
no |
|
GWC |
yes |
yes |
|
GWC |
yes |
no |
|
WWC |
yes |
yes |
|
WWC |
yes |
yes |
|
WWC |
yes |
no |
|
WWC |
yes |
no |
All supported BWC’s and GWC’s can be read using windkit.read_bwc() and windkit.read_gwc(), respectively.
For WWC’s, file-specific readers are available:
.rsf:windkit.read_rsffile()
.wrg:windkit.read_wrgfile()
.grd:windkit.read_grdfile()
.pwc:windkit.read_pwcfile()
For writing wind climate files, windkit have the function windkit.bwc_to_tabfile() for writing BWC’s to the .tab format,
windkit.to_libfile() for writing GWC’s to .lib files, and
windkit.to_rsffile() and windkit.to_wrgfile() for writing WWC’s to .rsf and .wrg.
To explify, lets start by reading in a BWC stored in the .omwc file format:
In [4]: bwc = wk.read_bwc("source/tutorials/data/SerraSantaLuzia.omwc", crs="EPSG:4326")

In [5]: print(bwc)
<xarray.Dataset>
Dimensions:       (point: 1, sector: 12, wsbin: 32)
Coordinates:
    height        (point) float64 25.3
    south_north   (point) float64 41.74
    west_east     (point) float64 -8.823
    crs           int8 0
  * wsbin         (wsbin) float64 0.5 1.5 2.5 3.5 4.5 ... 28.5 29.5 30.5 31.5
    wsceil        (wsbin) float64 1.0 2.0 3.0 4.0 5.0 ... 29.0 30.0 31.0 32.0
    wsfloor       (wsbin) float64 0.0 1.0 2.0 3.0 4.0 ... 28.0 29.0 30.0 31.0
  * sector        (sector) float64 0.0 30.0 60.0 90.0 ... 270.0 300.0 330.0
    sector_ceil   (sector) float64 15.0 45.0 75.0 105.0 ... 285.0 315.0 345.0
    sector_floor  (sector) float64 345.0 15.0 45.0 75.0 ... 255.0 285.0 315.0
Dimensions without coordinates: point
Data variables:
    wdfreq        (sector, point) float64 0.05314 0.03321 ... 0.1148 0.0707
    wsfreq        (wsbin, sector, point) float64 0.02601 0.04219 ... 0.0 0.0
Attributes:
    Conventions:      CF-1.8
    history:          2024-06-11T13:38:19+00:00:\twindkit==0.8.0\tcreate_data...
    wasp_header:      SerraSantaluzia
    Package name:     windkit
    Package version:  0.8.0
    Creation date:    2024-06-11T13:38:19+00:00
    Object type:      Binned Wind Climate
    author:           DTU CI Config
    author_email:     pywasp@dtu.dk
    institution:      DTU Wind
In this case, the .owmc file only contains coordinates, but not the coordinate reference system (CRS), so we have to set that
explicitly with the crs="ESPG:4326" argument.
As Discussed BWC’s are xarray.Dataset’s’ so it is easy to
use the all the built-in methods of xarray to interact with the data through the labeled dimensions and coordinates.
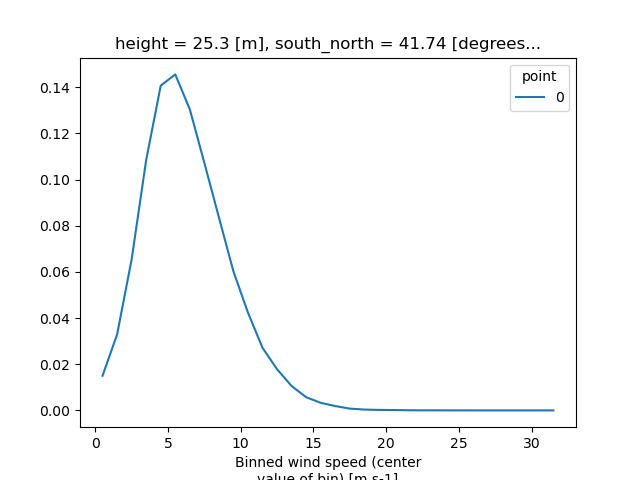
For example, we can plot the omni-directional wind speed frequencies by multiplying the wind speed frequencies, that are stored
as sector-relative frequencies, with the wind direction frequencies, summing the sectors, and then plotting with the wind speed
bins on the x-axis:
In [6]: (bwc.wsfreq * bwc.wdfreq).sum(dim="sector").plot.line(x="wsbin")
Out[6]: [<matplotlib.lines.Line2D at 0x7f850ff6ae50>]
Geospatial transforms
WindKit's spatial module makes it easy to work with geospatial data, like the point associated with
the BWC above, and to perform typical transforms, such as reprojection, spatial clipping, and spatial masking.
To illustrate this, let’s transform the BWC from lat-long coordinates to UTM 29N coordinates:
In [7]: bwc = wk.spatial.reproject(bwc, to_crs="EPSG:32629")

In [8]: print(bwc)
<xarray.Dataset>
Dimensions:       (point: 1, sector: 12, wsbin: 32)
Coordinates:
    height        (point) float64 25.3
    crs           int8 0
  * wsbin         (wsbin) float64 0.5 1.5 2.5 3.5 4.5 ... 28.5 29.5 30.5 31.5
    wsceil        (wsbin) float64 1.0 2.0 3.0 4.0 5.0 ... 29.0 30.0 31.0 32.0
    wsfloor       (wsbin) float64 0.0 1.0 2.0 3.0 4.0 ... 28.0 29.0 30.0 31.0
  * sector        (sector) float64 0.0 30.0 60.0 90.0 ... 270.0 300.0 330.0
    sector_ceil   (sector) float64 15.0 45.0 75.0 105.0 ... 285.0 315.0 345.0
    sector_floor  (sector) float64 345.0 15.0 45.0 75.0 ... 255.0 285.0 315.0
    west_east     (point) float64 5.147e+05
    south_north   (point) float64 4.621e+06
Dimensions without coordinates: point
Data variables:
    wdfreq        (sector, point) float64 0.05314 0.03321 ... 0.1148 0.0707
    wsfreq        (wsbin, sector, point) float64 0.02601 0.04219 ... 0.0 0.0
Attributes:
    Conventions:      CF-1.8
    history:          2024-06-11T13:38:19+00:00:\twindkit==0.8.0\tcreate_data...
    wasp_header:      SerraSantaluzia
    Package name:     windkit
    Package version:  0.8.0
    Creation date:    2024-06-11T13:38:19+00:00
    Object type:      Binned Wind Climate
    author:           DTU CI Config
    author_email:     pywasp@dtu.dk
    institution:      DTU Wind
Note
Note that the west_east and south_north coordinate values have changed after reprojection.
To set and get the crs of an object, use windkit.spatial.add_crs and windkit.spatial.get_crs.
Calculate statistics
WindKit includes functions to calculate common statistics from wind climate objects, such as the mean wind speed or mean power density:
In [9]: mean_ws = wk.mean_windspeed(bwc)

In [10]: print(mean_ws)
<xarray.DataArray 'wspd_combined' (point: 1)>
array([6.28573163])
Coordinates:
    height       (point) float64 25.3
    crs          int8 0
    west_east    (point) float64 5.147e+05
    south_north  (point) float64 4.621e+06
Dimensions without coordinates: point
Attributes:
    cell_methods:   sector: combined
    description:    Mean wind speed for all wind directions, representing the...
    long_name:      Horizontal Wind Speed
    standard_name:  wind_speed
    units:          m s-1
    grid_mapping:   crs
Note
The omni-directional statistics are returned by default. To return statistics by
wind direction sector, use the argument bysector=True
Fit weibull distribution
WindKit can fit weibull parameters to the wind speed frequencies in a binned wind climate, thereby
transforming it to a weibull wind climate. This can be done using windkit.weibull_fit():
In [11]: wwc = wk.weibull_fit(bwc)

In [12]: print(wwc)
<xarray.Dataset>
Dimensions:       (sector: 12, point: 1)
Coordinates:
    height        (point) float64 25.3
    crs           int8 0
  * sector        (sector) float64 0.0 30.0 60.0 90.0 ... 270.0 300.0 330.0
    sector_ceil   (sector) float64 15.0 45.0 75.0 105.0 ... 285.0 315.0 345.0
    sector_floor  (sector) float64 345.0 15.0 45.0 75.0 ... 255.0 285.0 315.0
    west_east     (point) float64 5.147e+05
    south_north   (point) float64 4.621e+06
Dimensions without coordinates: point
Data variables:
    wdfreq        (sector, point) float64 0.05314 0.03321 ... 0.1148 0.0707
    A             (sector, point) float64 5.47 5.346 5.746 ... 8.029 7.312 6.022
    k             (sector, point) float64 1.924 2.145 2.594 ... 2.265 2.185 1.97
Attributes:
    Conventions:      CF-1.8
    history:          2024-06-11T13:38:19+00:00:\twindkit==0.8.0\tcreate_data...
    wasp_header:      SerraSantaluzia
    Package name:     windkit
    Package version:  0.8.0
    Creation date:    2024-06-11T13:38:19+00:00
    Object type:      Weibull Wind Climate
    author:           DTU CI Config
    author_email:     pywasp@dtu.dk
    institution:      DTU Wind
We can check that the estimated mean wind speed of the WWC is close to the BWC above:
In [13]: mean_ws_wwc = wk.mean_windspeed(wwc)

In [14]: print(mean_ws_wwc)
<xarray.DataArray 'wspd' (point: 1)>
array([6.24057066])
Coordinates:
    height       (point) float64 25.3
    crs          int8 0
    west_east    (point) float64 5.147e+05
    south_north  (point) float64 4.621e+06
Dimensions without coordinates: point
Attributes:
    description:    Speed is the magnitude of velocity. Wind is defined as a ...
    long_name:      Horizontal Wind Speed
    standard_name:  wind_speed
    units:          m s-1
    grid_mapping:   crs
We see that the mean wind speed of the BWC and WWC differ by about 0.7% (6.29 vs 6.24 m/s). The weibull fit in WindKit (and in WAsP) uses the third moment of wind speed to fit Weibull parameters, thus preserving the mean power density well, but not the mean wind speed. We can check this by calculating and comparing the mean power densities pf the BWC and WWC.
In [15]: diff_prc = 100.0 * (1.0 - wk.power_density(wwc) / wk.power_density(bwc))

In [16]: print(diff_prc)
<xarray.DataArray (point: 1)>
array([2.22044605e-14])
Coordinates:
    height       (point) float64 25.3
    crs          int8 0
    west_east    (point) float64 5.147e+05
    south_north  (point) float64 4.621e+06
Dimensions without coordinates: point
We see that the difference in mean power density between the two is just 0.04%.
Using wind climates as site objects in PyWake
PyWAsP wind climates objects can be used as site objects for wind farm flow modeling in PyWake.
This is done by instanciating an XRSite using the py_wake.Site.XRSsite.from_pwc() method.
In [17]: import py_wake

In [18]: site = py_wake.site.XRSite.from_pwc(wwc)

In [19]: print(site.ds)
<xarray.Dataset>
Dimensions:           (i: 1, wd: 13, ws: 23)
Coordinates:
    h                 (i) float64 25.3
  * wd                (wd) float64 0.0 30.0 60.0 90.0 ... 300.0 330.0 360.0
    x                 (i) float64 5.147e+05
    y                 (i) float64 4.621e+06
  * ws                (ws) int64 3 4 5 6 7 8 9 10 11 ... 18 19 20 21 22 23 24 25
Dimensions without coordinates: i
Data variables:
    Sector_frequency  (i, wd) float64 0.05314 0.03321 0.04742 ... 0.0707 0.05314
    Weibull_A         (i, wd) float64 5.47 5.346 5.746 6.73 ... 7.312 6.022 5.47
    Weibull_k         (i, wd) float64 1.924 2.145 2.594 ... 2.185 1.97 1.924
    Speedup           (i, wd) float64 1.0 1.0 1.0 1.0 1.0 ... 1.0 1.0 1.0 1.0
    TI                (i, wd) float64 0.0 0.0 0.0 0.0 0.0 ... 0.0 0.0 0.0 0.0
Attributes:
    Conventions:      CF-1.8
    history:          2024-06-11T13:38:19+00:00:\twindkit==0.8.0\tcreate_data...
    wasp_header:      SerraSantaluzia
    Package name:     windkit
    Package version:  0.8.0
    Creation date:    2024-06-11T13:38:19+00:00
    Object type:      Weibull Wind Climate
    author:           DTU CI Config
    author_email:     pywasp@dtu.dk
    institution:      DTU Wind
    sector_width:     30.0
Spatial inhomogeneity can be taken into account in PyWake by speedup and turning variables in the site object.
These variables track the relative speed-up and turning of the wind in the spatial domain during the wind farm flow modeling.
The py_wake.Site.XRSsite.from_pwc() method can take different speedup arguments for specifying the way to calculate speed-ups
between spatial points. By default, the “park” method is used, which calculates the sector-wise speed-ups relative
to the maximum mean wind speed in that sector.
Depending on how the speed-up is defined/calculated in the PyWake site object, the post-processing, or aggregation, of wind farm flow results should take this into account.